


Good Morning Traders and Investors and thank you for joining me for another edition of the Magnelibra Markets Podcast, I’m your host Mike Agne and today’s episode #36 is entitled “Profit Taking Hits The Markets”
Quick Disclaimer: The following podcast is for educational purposes only. This is not a solicitation to buy or sell commodity futures or options. The risk of trading securities, futures and options can be substantial and may not be appropriate for all listeners.
The markets were hit yesterday after a hotter than expected CPI report which showed an increase of 0.3% month over month with the majority of this coming from the shelter component which includes rent accounting for more than 2/3rds the rise in CPI. As far as the YoY Core CPI it increased to 3.9% +0.4% and higher than expected. When we look at this on the forefront it looks as if consumers are chasing here and demand for housing is the cause but is it? We believe that the massive amount of multiple home investing by large conglomerates leads to a pricing power advantage causing prices to remain elevated. We talk about this all the time the fact that large players play a significant role in keeping rents elevated due to the inelasticity that conglomerates enjoy due to their larger capital base.
So what do we mean, first off lets try to break this down, elasticity is a term used to describe how the quantity supplied or demanded of a good changes when its price changes. If a small change in somethings price causes demand to change drastically that is considered elastic. So in the case of conglomerates that own a lot of residential real estate rental properties, they will not lower their rents as quick as an individual owner because they have the wherewithal to withstand a few months or even a years worth of waiting for the right renter at their price. We can also assume that a wealthy rental property owner may also have the luxury of waiting for the right renter at his price and not have to lower their price to attract a new renter, especially in higher demand areas with limited supply. So all in all we believe rental inflation is sticky not because consumer demand is strong but rather because there is this massive concentration of wealth that allows for the rigidity in prices due to the nature of the owners balance sheet.
How long this can last is anyone’s guess, however the FOMC may look at this as an inflationary signal when in reality it is anything but. From our standpoint this is the system they have created and rents will remain high as long as the owners liquidity is sufficient to not have to lower pricing. Having a massive concentration of wealth and a disproportionate share of overall wealth leads to massive dislocations in traditional supply/demand dynamics in a given economy and this is what we are seeing now.
We know that mortgage applications are still negative YoY as indicated by this chart that Lance Lambert on X shared:

This makes sense right, because honestly who is going to finance a property at 7% plus rates? Nobody unless you have too and in reality cash rich investors will just seek out investments and returns above and beyond traditional safe investments like static bank and cash accounts and why not? There is a whole generation 15 years removed from the GFC that believes prices never stagnate or fall and if a Covid like scenario comes around again, well the money drop will be so massive that you can’t lose buying property now!
All in all this CPI signal to us is a false one, it is not accounting for the sea change in concentration of wealth which exacerbates pricing and skews valuation but is a direct result of the 10x plus increase in base money supply over the last 15 years or so. The FOMC will have a hard time justifying the next rate cut but it will be on the heels of a large banking crisis or collapse most likely from the induced from the overall leveraged and highly concentrated in MF and CRE regional banking sector. Yea 50% plus write downs are real losses that someone is bearing and eventually this will crater ones balance sheet, its only a matter of time! The concentration of wealth is all but a done deal, but for those over leveraged types they will be consumed by the negative carry of higher short term interests above those rates one can obtain in the longer run. Simply put, the regional banks will run out of both time and money!
Speaking of the concentration of wealth, take a look at this next chart from DBank:

What makes this chart so scary is that it not only confirms the massive one way concentration of wealth in just a small minority, but the fact that in the modern day QE era with a wide dispersion of investing prowess, that diversification for all intents and purposes is gone. We have talked at length as to why this is the case, but the fact that this concentration level is double that of the DotCom bubble is truly frightening, but then again its AI Mania and AI will usher in a whole new era! An era of what, well that is to be determined! History has not dealt well with such concentrations but then again those that don’t study history are doomed to repeat it!
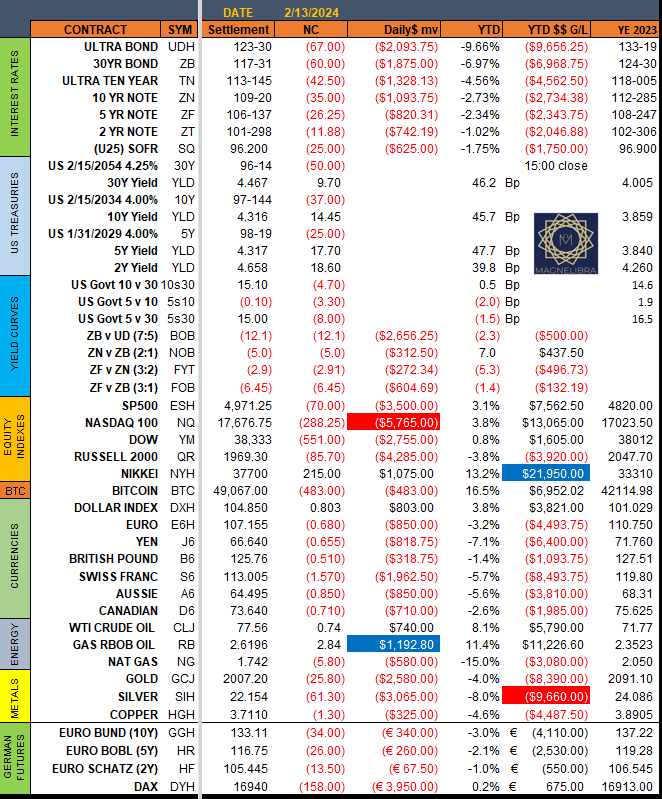
OK onto yesterday’s settlements, where the bond market continues to push rate cuts further and further down the road as the 30Y is now back above 4.45%. The equities were pounded from all the profit taking but recovered some by the close with the Nasdaq futures down -288.25 points and SP500 lost 70 points with the R2k hammered by 85.70. The US dollar was strong across the board with the SF the biggest loser down 157pips. Crude and RBOB continue to move higher and $78 is near which is the first real resistance and sale level here for new shorts and Metals were hit as well led by Silver down 61.3 cents:
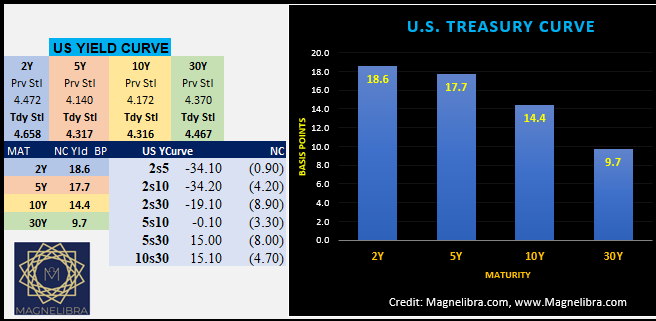
As far as the US Bond Yield Curves you can see the 2Y with a massive 18.6bp gain on the day leading all curves to be flatter on the day:
As far as the Futures Model Tracker the down move in risk forced out some liquidations across the board:

The MEGA8s were led lower by 2% down moves in MSFT, AMZN, and Tesla with Nvidia holding in the best only down fractionally:

As far as the Market Cap chart of the group its back below the $14T total market cap marker and we will use the 21p MA as our gauge base line support now for the group, we won’t turn bearish on the package till that is breached:

One technical chart we want to post here is the Nasdaq futures hourly chart. You guys saw our red trend lines from our previous chart showing an increasing steepness to their trajectory. This steepness is caused by retail chasing every down tick and bidding it up higher and higher and we noted that this kind of chasing never ends well. So the first steep red trend line was breached yesterday and support was led by the next trendline underneath shown here. So for today on the hourly the 17700 level needs to hold to withstand opening the door to further downside probes:

For now lets see if a enough weak hands have sold out post CPI and the market can stabilize today or if the 17700 level gives way, should see a test again of 17600 to see whose who!
Anyway technically that is what we are looking at. The markets just took the news yesterday as a reason to take some profits and that is about all we are seeing out of that. Overall equities are still very elevated and some selling with consolidation is healthy from our perspective and should be expected at times, so don’t look more into yesterday’s moves than we have too.
Ok that’s it guys, we hope you learned something today. Thank you to all our supporters and thank you to those that share our work as well. Till next time, and if you haven’t already, please consider hitting that subscribe button, Cheers!


Share this post