


Welcome to another edition of the Magnelibra Markets Podcast. Today’s title is The Vix Pops, Equities Drop and the Bonds Are Well Bid.
We hope these podcasts are bringing a little different element to our newsletter and we look to continue to bring fresh analysis to our readers, investors and traders out there. We have a lot to get into today so let’s get to it!
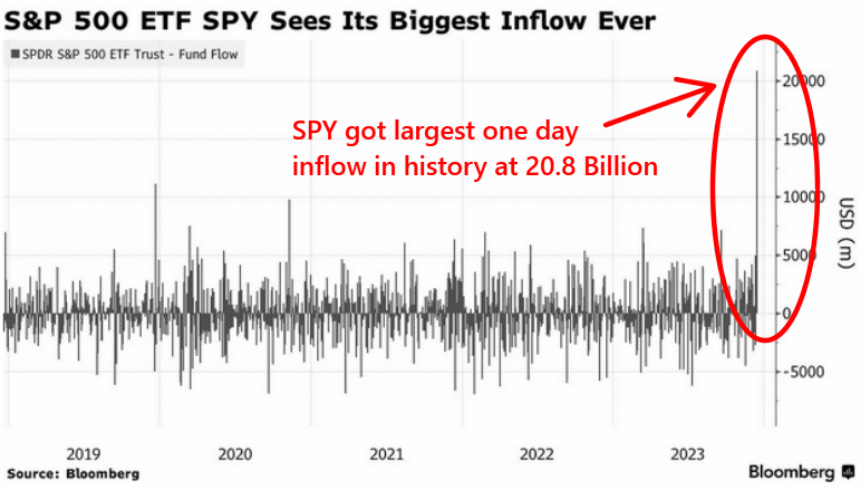
Its been a very long time since we’ve had an adverse equity market move, and the X platform wasn’t short on the commentary that’s for sure. We did pick a couple of nice charts for you guys today and why don’t we start with a look at the massive amount of buying in the SPY ETF from Bloomberg which shows a near 3x jump from even some of the highest inflows over the last 5 years:
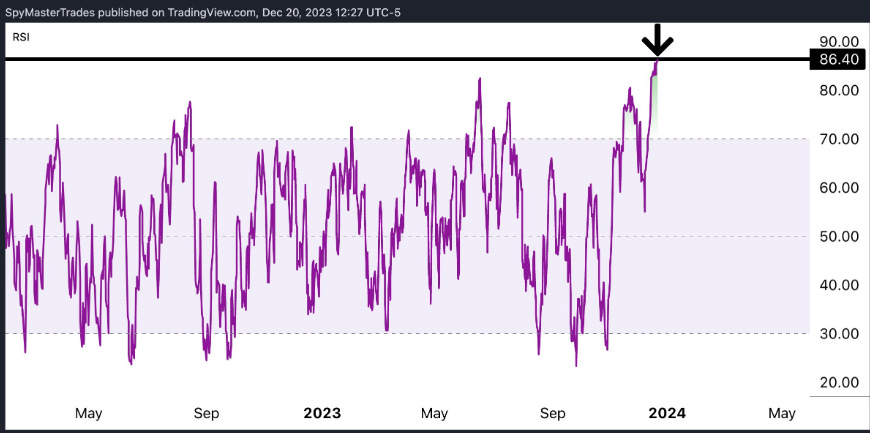
We know this has led to some very overbought technical indicators like the RSI readings, a very lofty 86.4, which SpyMasterTrades posted on X:
As far as the Vix, well its been decimated lately and The Kobeissi Letter on X posted this graphic of the CBOE Vol Index which was back to the January 2020 lows:
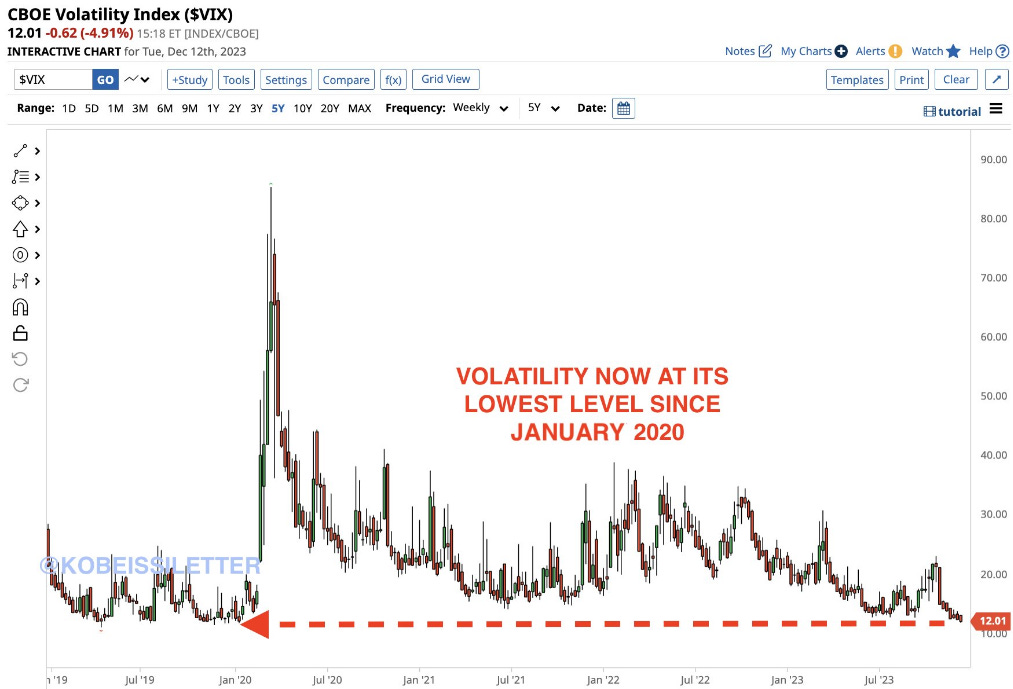
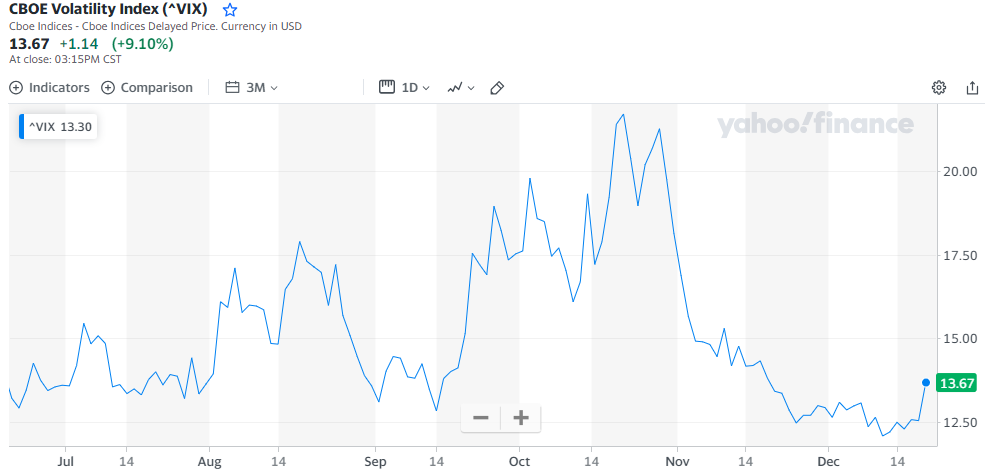
However we got a juicy 9% plus pop in it today as the VIX jumped 9.10% +1.14 closing at 13.67. Just for reference at the end of October the VIX was > 21!
We all know that the 0DTE options and the VIX are used as market manipulation and control mechanisms. Look 0DTE options are nothing more than exchange created volume producers that induce big money to lever positioning in a way that it can control the outright markets and it entices all the gamblers to take their shot with their lottery tickets. The problem with the VIX being so low was that there really wasn’t any more room left to manipulate, you can only sell so many puts and drive VIX down so far. Well that limit was apparently reached today and the dealers and market makers were left scrambling. There was also a big buyer of the SP 0DTE 4755 put today increasing market makers long exposure and thus, forced selling ensued.
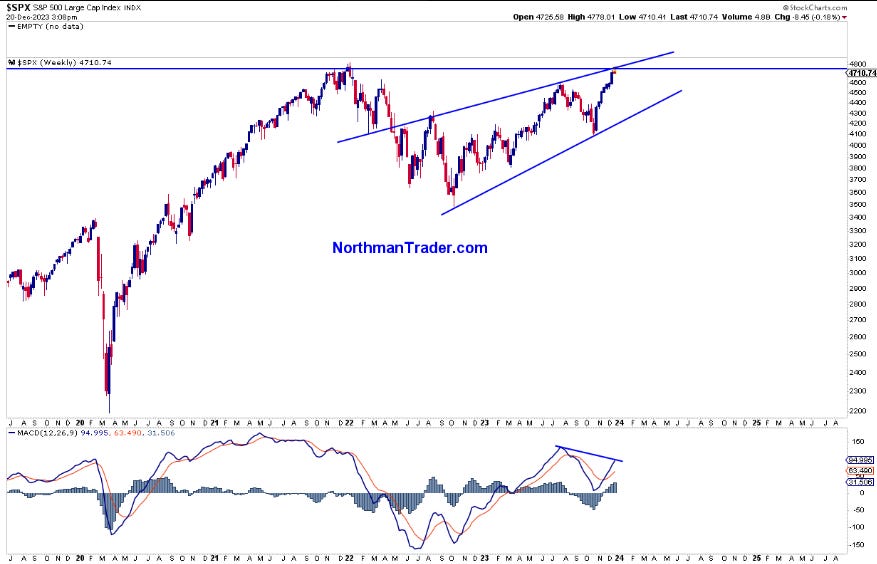
The market even forced Northman Trader to post this technical chart, which has the 4710 weekly resistance level in the SPX. Obviously we see a similar technical resistance point and as we talked about it yesterday a close on the week of 4700 would be a devastating blow for the bull run into year end. Sven notes below his chart the diverging MACD, and what is meant by diverging is the momentum comparatively over time is moving lower, meanwhile the nominal price of the market continues to press higher. This is a classical divergence set up and foreshadows a waning breadth in the overall trend:
Alright, so what did we learn today? We learned that the technical levels in the equities hit some major resistance and a few accounts took this as a rational reason to sell and take some profits. Now all things considered, the markets have had a massive run so this does not surprise us. It doesn’t change things too much, one day does not make a trend, but what it does is, is it puts a minor dent in the pristine image the equities have had over the last 7 weeks or so. Now the focus will be on the weekly close before the holiday and year end. Do we attack new highs or do we continue to sell off from here? Those are the contemplations we as investors and traders need to ponder upon.
Technically the markets have set the stage to sell off, so we suspect this will drag a few shorts in but their tolerance to cover will be very small, so expect volatile rips up even after a consistent sell down.
As far as the other markets we know the US Bond Market has also been on a bull run lately, Charlie B on X posted this nice graphic showing the 8.7% Bloomberg US Aggregate Bond Index rolling 40 day performance. This is higher than any other data point in the last 30 years and its not even close:
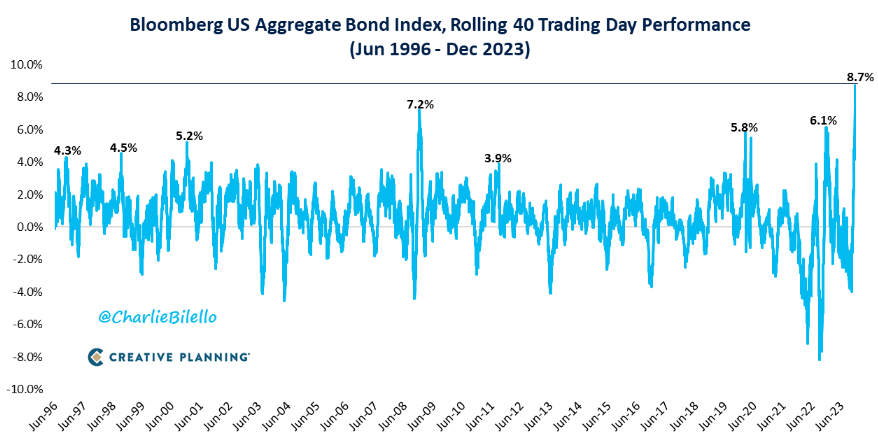
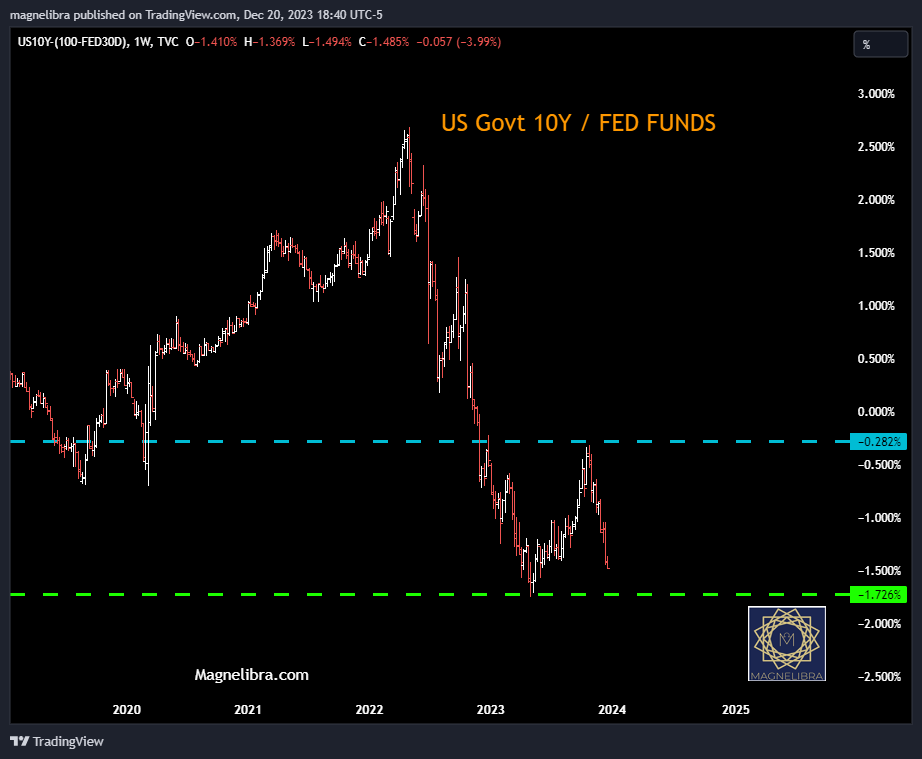
What this tells us is that someone large was blown out on those yield high prints up to 5% and now that time has passed and Powell has conceded the global bond players have done the heavy lifting for the Federal Reserve and have cleared the path to cut rates. It will be interesting to see just how far the 10s/Fed Funds spread gets inverted, today we down near -150bp again. If the bond bulls keep going, we would think a -200bp spread would warrant an FOMC emergency rate cut, so will see how this all transpires:
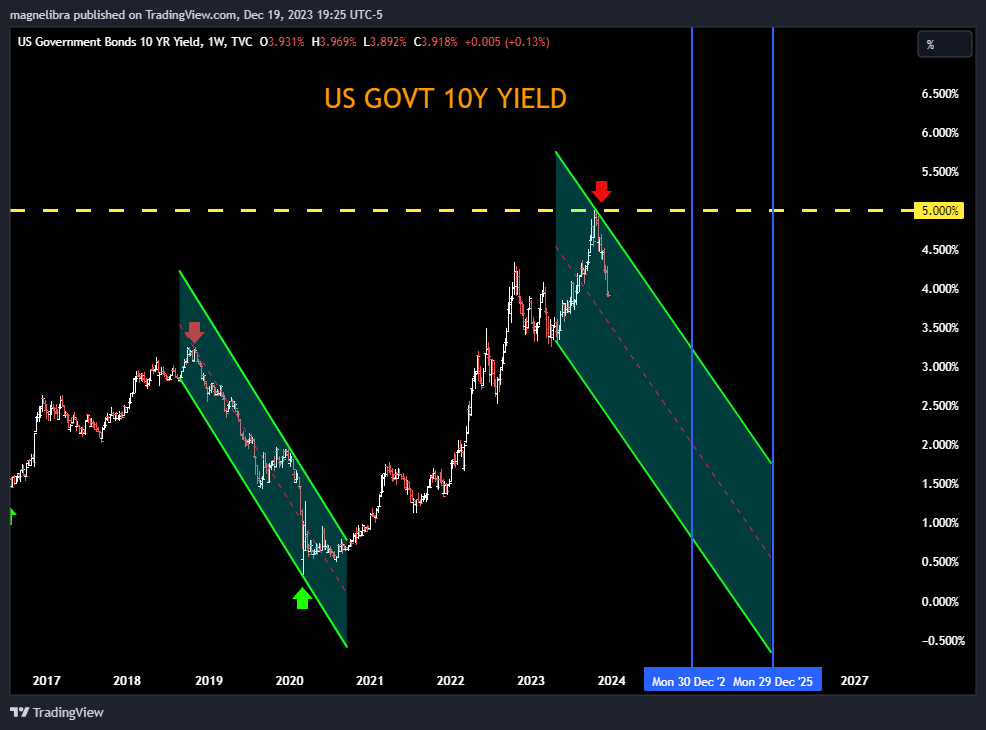
As we noted in our podcast yesterday, we view the 10Y as highly undervalued and will continue to expect it to work its way toward 2% next year:
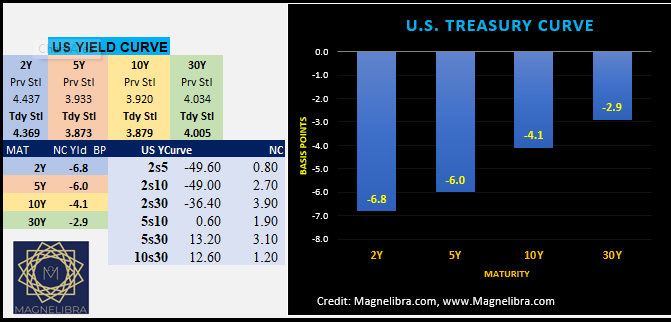
The yield curve today put in a decent bull steepening move with the US Govt 2s -6.8bp while the 30Y was only down -2.9bp:
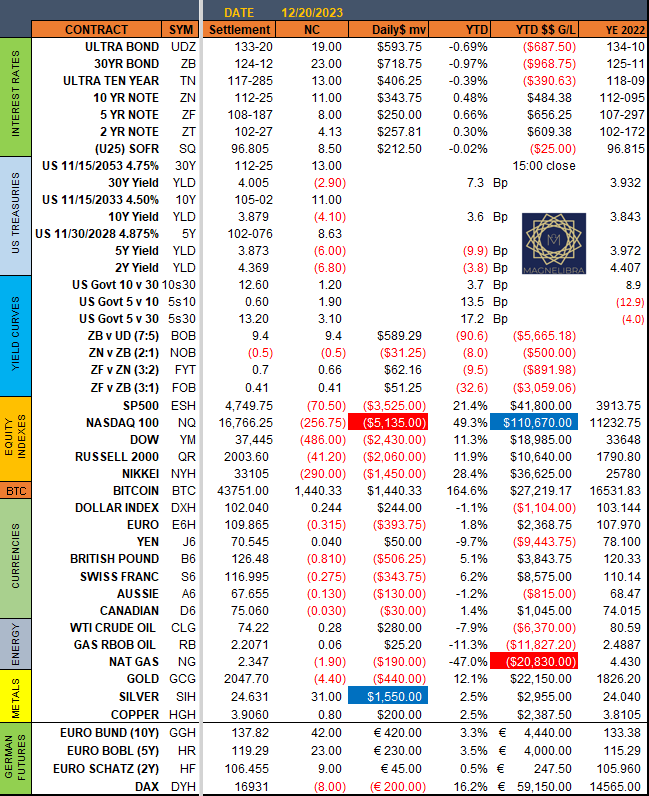
Alright let’s look at the settlement sheet for today where the Nasdaq was the biggest loser on the day dropping 256.75 points with Silver the dollar value contract winner +31 cents:
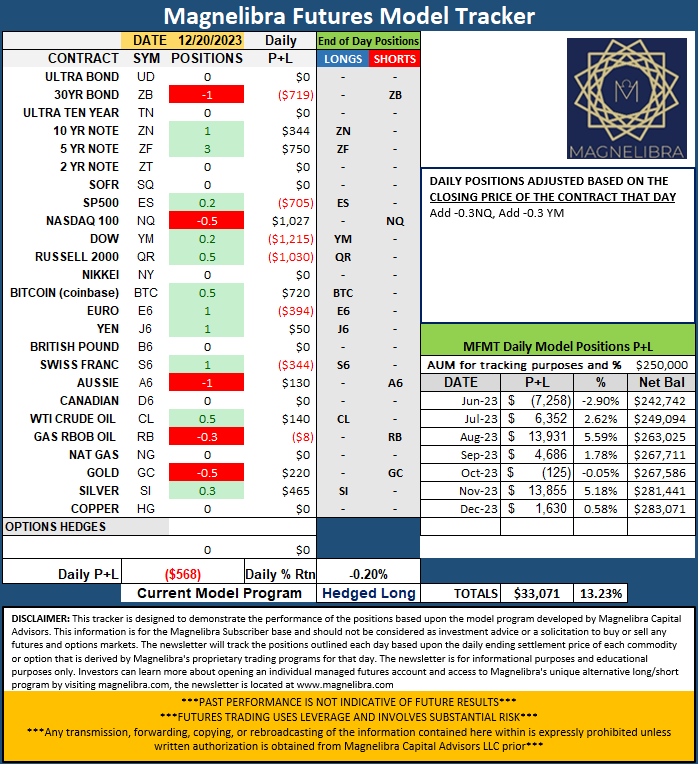
Today’s move caused a few changes to our Futures Model Tracker where the program added 0.3 shorts in the Nasdaq and 0.3 shorts in the Dow futures:
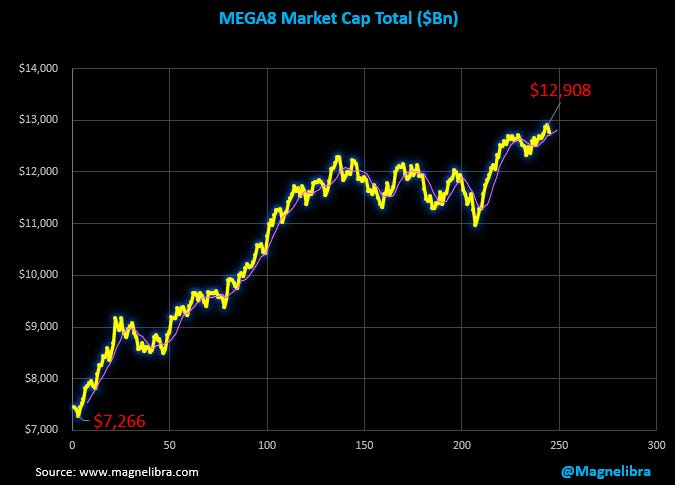
When we look at the Magnelibra MEGA8s, well the grouping as a whole lost 1.5% today with Google the only positive, but lets be honest the group is still sitting at $12.77T in market cap:
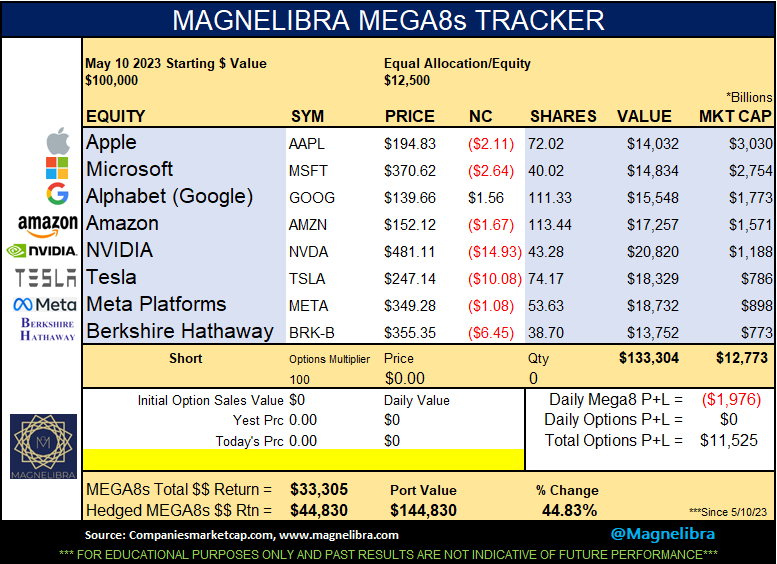
We suspect this grouping to continue to suffer and we will most likely put a hedge on tomorrow for next weeks expiration:
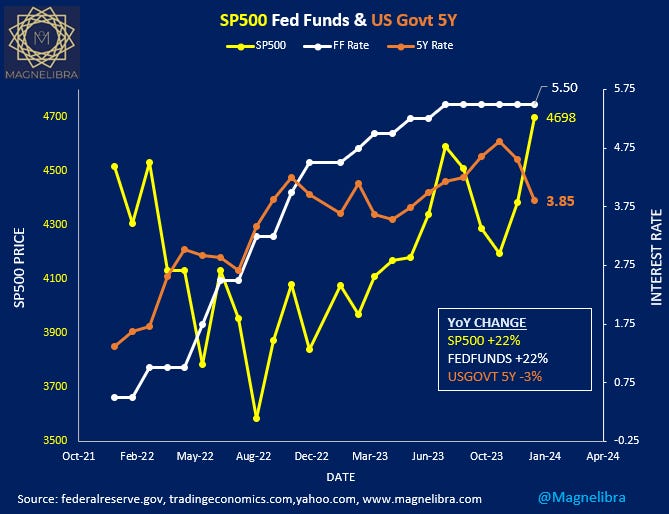
When we compare the SP500 to the Fed Funds and US govt 5Y we can see the Fed Funds ceiling and most likely the high of the cycle but its interesting to note that the 5Y is diverging down from the SP500 something that we believe will generally have to revert, the equities can only ignore this for so long:
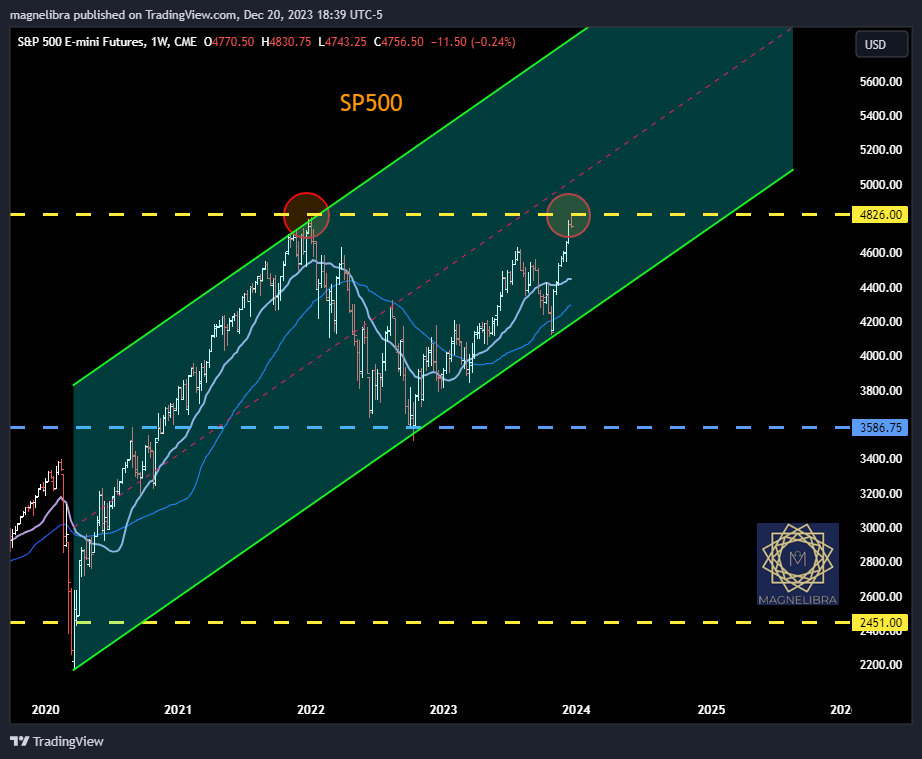
Ok let’s look at a few technical charts now, the first one being the SP500 futures where we noted yesterday the importance of the 4800 level and today, wow what a difference a day makes, as the SP500 is now off some 80 points or so off that 4830 high:
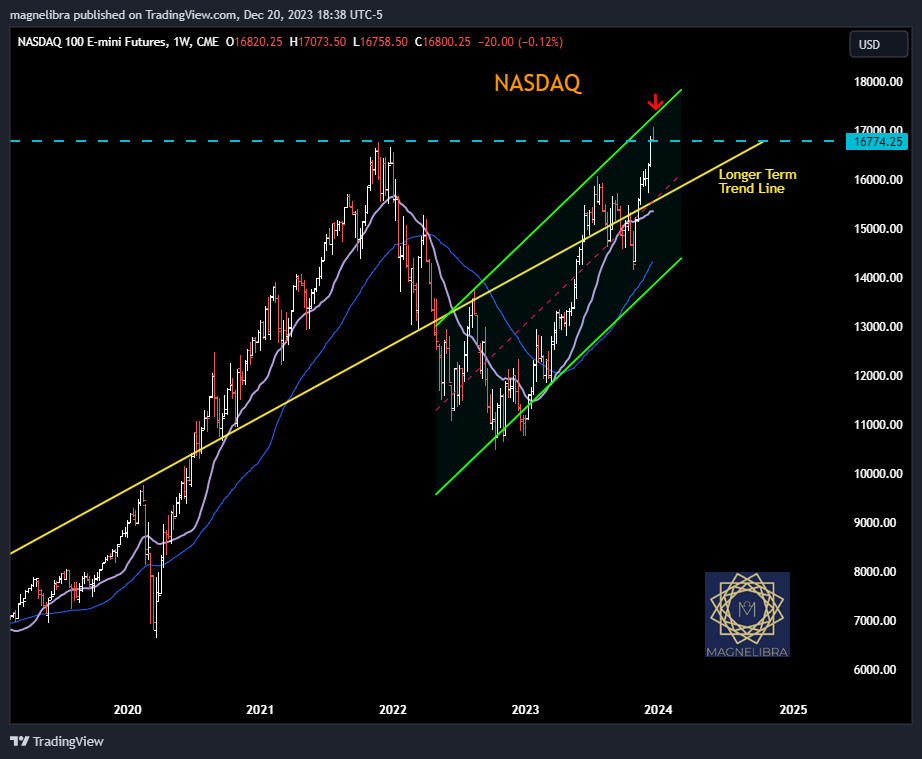
The same setup is likely in the Nasdaq with the 16774 level and go figure we close right below it at 16766:
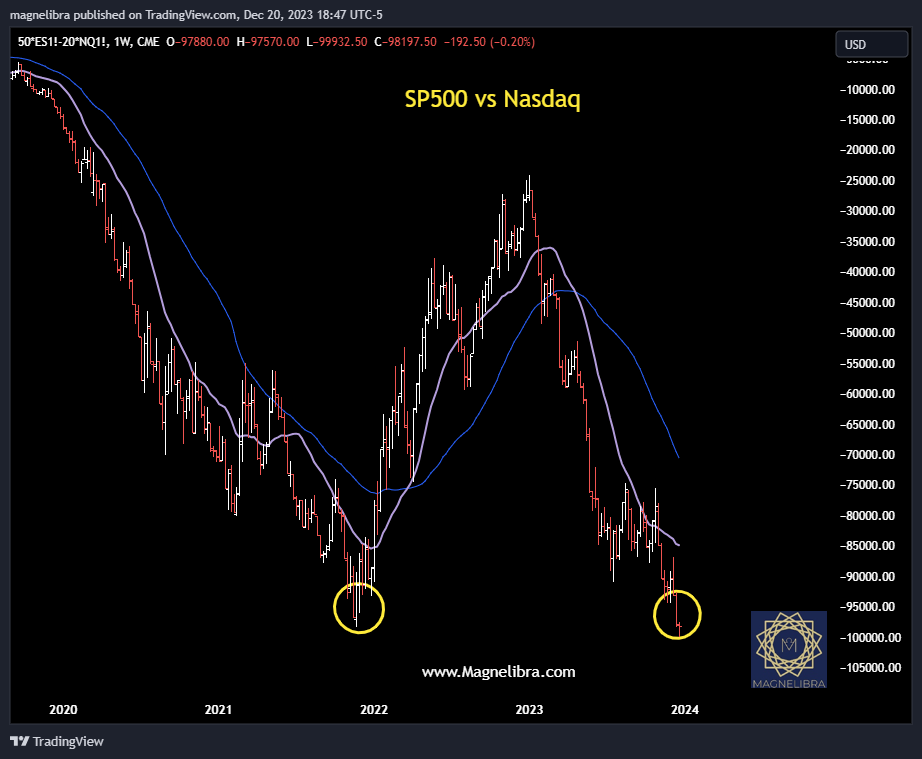
The last chart we want to review is the SP500 vs the Nasdaq which this week put in a new weekly low for the spread. The question becomes how big is this trade, how strong are the players and truly are 8 stocks holding up the entire boat and how likely is this to continue or will it get even worse the concentration of wealth if we do indeed move into a hard landing:
Alright that is all for now we hope you enjoyed this edition of the Magnelibra Markets. Please like share and subscribe and if you can thank you for supporting our work. Our goals are simple, to educate you with our experience in hopes that you can formulate your own ideas and methodologies as well as convey what we see and see if it drives you to dig further into the topic that we cover. Alright that’s all for now, till next time, stay safe, cheers.


Share this post